


Holdings
Holdings in global gold-backed ETFs and similar products rose sharply in June by 127 tonnes (t) to 2,548t. This is equivalent to US$5.5bn in inflows. As geopolitical uncertainty increased and central banks signalled a shift to a more accommodative policy over the coming months. This drove rates and the US dollar lower and shifted the momentum in gold as its price moved to a six-year high.
Regional fund flows*
North American funds had inflows of 65t (US$2.9bn, 5.0% AUM)
Holdings in European funds rose by 59t (US$2.5bn, 4.7%)
Funds listed in Asia increased by 2.4t (US$107mn, 3.3%)
Other regions had inflows of 0.4t (US$16mn, 1.2%).
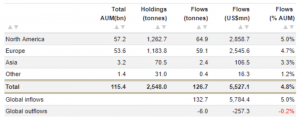
Data as of 30 June, 2019
Sources: Bloomberg, Company Filings, ICE Benchmark Administration, World Gold Council
Individual fund flows
– In North America, SPDR® Gold Shares added 51t (US$2.2bn, 7.2%), and experienced its largest, one-day inflows of all time on 21 June, while iShares Gold Trust added 12t (US$537mn, 4.6%) and low-cost gold-backed ETFs added $72mn or 3% of assets.‡
– In the UK, ETFS Physical Swiss Gold added 23t or nearly US$1bn and grew by 115% during the month. iShares Physical Gold ETC added 20t (US$900mn, 21%) and Invesco Physical Gold added 5.7t (US$, 240mn, 4.2%)
– In China, Bosera’s listed fund added US$45mn or 13% of its assets last month, and Huaan Yifu added $43mn, but leads global outflows on the year losing US$348mn or 32% of its assets.
Long term trends
European gold-backed ETF holdings represent its largest percentage of total global assets in history at 47% of total assets, trailing North America by US$3.6bn
Flows in the larger North American funds have been momentum driven with the recent price increase pushing y-t-d flows into positive territory (2.7% of AUM)
Long-term strategic holders continue to add to low-cost gold-backed ETFs on a consistent basis, with inflows during 12 of the past 13 months, growing 84% percent over that period‡
Outflows of more than 11% in Chinese funds have been a function of profit taking and a shift to riskier assets in the region
Political uncertainty and a weaker pound sterling have supported inflows to UK-based gold-backed ETFs, which remain at all-time highs. UK-based holdings have grown to 554t or 22% of global gold-backed ETF assets.

Data as of 30 June, 2019
Sources: Bloomberg, Company Filings, ICE Benchmark Administration, Shanghai Gold Exchange, World Gold Council
*Note:
We calculate gold-backed ETF flows both in ounces/tonnes of gold. And in US dollars, because these two metrics are relevant in understanding funds’ performance. The change in tonnes gives a direct measure of how holdings evolve. While the dollar value of flows is a finance industry standard that gives a perspective of how much investment reaches the funds. There are some months where the reported flows measured in tonnes of gold and their dollar-value equivalent seem inconsistent across regions.
Both figures are correct. The disparity is due to the interaction between the performance of the gold price intra-month. As well as the direction and movement of the US dollar and the timing of the flows. If, for example, European funds were to experience outflows early in the month when the price of gold was low. But, gained assets later in the month when the price of gold increased. And/or if the euro/dollar currency rate moved meaningfully when there were flows. Then there might be a discrepancy between tonnage change and flows.
‡ Low-cost US-based gold backed ETFs are defined as gold-backed ETF. These trade on US markets with annual management fees of 20bps or less.
† Net longs represent Money Manager and Other Net long positioning in the COMEX futures market.
Or
Go Back To All Articles Here: https://goldnotes.com/category/latest/