


“On the surface, activity in precious metals markets was subdued during the week ended Friday, April 26. Spot gold rose 0.85% to $1,290.35 and spot silver increased 0.67% to $15.09. During the week, the U.S. Dollar Index (DXY) increased 0.64% to 98.01 and 10-year Treasury yields declined 6 basis points to 2.498%. Spot gold ended the week 72 basis points above its trailing two-year average of $1,274.76. While silver closed the period 6.0% below its two-year average of $16.04.
Just below the surface, trading in Western precious metals markets has assumed a technical tone.
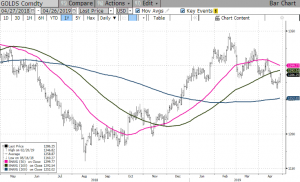
After advancing 16.08% from an 8/16/18 intra-day low ($1,160.27) to a 2/20/19 intra-day high ($1,346.82). Spot gold has spent the past two months consolidating its gains in the midst of a pattern of converging moving averages. As shown in Figure 1, spot gold’s trading range this past week was entirely below its 50-day moving average ($1,299.77) and its 100-day moving average ($1,292.54), and therefore appeared destined to test support at its 200-day moving average at $1,252.02. To the degree technical traders might be excited by such a classic “check” of support, we have been willing to concede such a trading path might actually prove to be the most efficient and healthy manner to reenergize gold’s ascent since mid-August 2018.
Figure 1: Spot Gold versus 50-Day, 100-Day & 200-Day Moving Averages (4/27/17-4/26/19)”
Or
Go Back To All Articles Here: https://goldnotes.com/category/latest/